This post was published at the Speakeasy on 3/31/23, a little over a month and a half ago. Some of the rates mentioned in the post are higher now. $IRX, or the 3-month T-Bill, was yielding 4.57%, and is now up to 5.1%. The IORB, which was 4.9%, is now 5.15%. The ON-RRP was 4.8%, and is now 5.05%. And the ECB's DFR was 3%, and is now 3.25%. Also, don't miss the bonus comments at the bottom, about how the gold market actually works. 😉
In my New Year's post, I wrote:
Basically, the Fed controls interest rates by controlling the supply and demand of bank reserves (i.e., Fed liabilities). Before 2008, there was a naturally-low demand for reserves, and the Fed adjusted that low demand in two ways, by capping the rate banks paid for extra reserves when needed, and by adjusting reserve requirements. It controlled the supply of reserves in the system through open market operations, where it could increase supply by buying securities, or decrease supply by selling securities (buying back its own liabilities). But it was limited in how much it could increase supply by the naturally-low demand. If it raised supply above demand, it would lose control of monetary policy. Demand would turn negative. Interest rates would turn negative. Banks would shun depositors and start charging them interest on their deposits. Cash withdrawals would skyrocket, the dollar would plummet, and the dollar system would collapse.
The point is, the scarce reserves system before 2008 naturally constrained the Fed’s ability to print.
After 2008, it switched to an “ample reserves” system, where it controls interest rates by the rate of interest it pays on reserves parked at the Fed. This created a new demand for reserves.
You might remember this graph from Hyperinflation Update Update:
 It shows that up until 2008, most of the money in the commercial banking system was backed by (and created by) loans. Since then, loans have held steady while total deposits kept rising.
What happened was, by creating a new demand for bank reserves, the Fed eliminated the constraint, was suddenly able to create an unlimited supply of bank reserves, buy an unlimited amount of securities, and indirectly finance the United States government, the housing market, and virtually any market it desired. In other words, QE became possible.
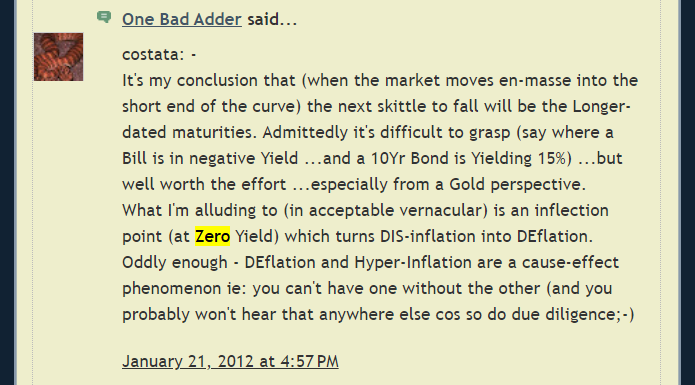
Anyone remember OBA/Topaz and his theory that the $IRX zero boundary was the Fiat System's Rubicon? Basically, he predicted that when the $IRX (3-month T-bill yield) turned definitively negative, it would be game over for the $IMFS. Here are a handful of his comments I picked at random to refresh your memory. You can find all of his 625 comments from 2009 to 2015 here and here. I don't know what happened to him, I haven't heard from him, and he never joined the Speakeasy:


 Of course, it never happened. We never breached the zero bound, even as we bounced off it for almost nine years (2008-2015 and 2020-2021). Here's the $IRX chart:

The Floor with High Balances approach is essentially how the Fed ended up conducting monetary policy starting in October 2008… The Fed continued to conduct policy using a floor system as successive rounds of QE increased the quantity of reserve balances further. It then officially adopted the floor system implementation approach in January 2019 (see “Statement Regarding Monetary Policy Implementation and Balance Sheet Normalization”).
When the staff evaluated a floor system in 2008, they envisioned a much more modest floor system than what transpired. The approach was expected to require about $35 billion in reserve balances, and the interest rate on reserve balances was expected to be 10 to 15 basis points below the fed funds rate. The Fed currently estimates that $2.3 trillion in reserve balances are necessary to implement a floor system. […]
The Fed’s estimate of the quantity of reserve balances required to implement a floor system has increased dramatically over time. In March 2016, the New York Fed raised its assumption about the level of reserve balances needed in equilibrium to $100 billion.[4] In 2017, it raised it to $500 billion.[5] The FOMC did not specify the quantity of reserves it thought would be necessary when it made its decision to use a floor system in January 2019, but in March 2018, the New York Fed put its estimate of that level at $600 billion; by September 2019, it had more than doubled its estimate to $1.3 trillion.[6]
[...]
In September 2019, a mismatch in the supply of and demand for repo financing led to a sharp spike in repo rates and unsettled repo markets for a week. In “Reserves were not so Ample After All,” Copeland, Duffie, and Yang (2021) attribute the dislocation in part to an insufficient supply of reserve balances, then $1.45 trillion.[8] The New York Fed has estimated that a buffer of at least $350 billion above the structural demand for reserves is needed to account for variation in reserve balances, which would put the amount needed to conduct a floor system at $1.8 trillion.[9]
That estimate has not been tested. In response to the September 2019 turmoil the Federal Reserve expanded the supply of reserve balances, and the Fed’s massive purchases of government securities in response to the COVID-19 pandemic increased the supply further. […]
Reserves balances a year ago were $3.96T. Today they are $3T, down $960B year over year (YoY), but still well above the Fed's current estimate of $2.3T needed to implement a floor system. That means that reserves (aka base money, or Fed liabilities) make up about 12.7% of the total assets held by the US banking system right now, down from 17.4% a year ago, a 27% decrease.
Today, the Fed controls the amount of reserves in the system through QE and QT. QE adds reserves, and QT removes them or extinguishes them. QE also tends to lower interest rates because the Fed is buying debt securities, which adds demand to the market for debt securities, which tends to raise the price of those securities, and a higher price equates to a lower interest rate (this is an important point to keep in mind, that price and interest rate have an inverse correlation). But the main way the Fed controls interest rates is the floor system. It sets a floor under interest rates by paying interest on the reserves it added through QE.
The Fed created a new kind of demand for reserves in 2008 with IOER, Interest on Excess Reserves (now, as of July 2021, changed to IORB, or Interest on [all] Reserve Balances). The amount of reserves demanded by the banking system has been growing ever since, and the Fed has been miscalculating that demand ever since.
So, QE pushes prices up, rates down and adds reserves, and the interest rate the Fed pays banks on those reserves sets the interest rate floor. Here is IOER from 10/9/08 through 2021 (discontinued on 7/28/21):


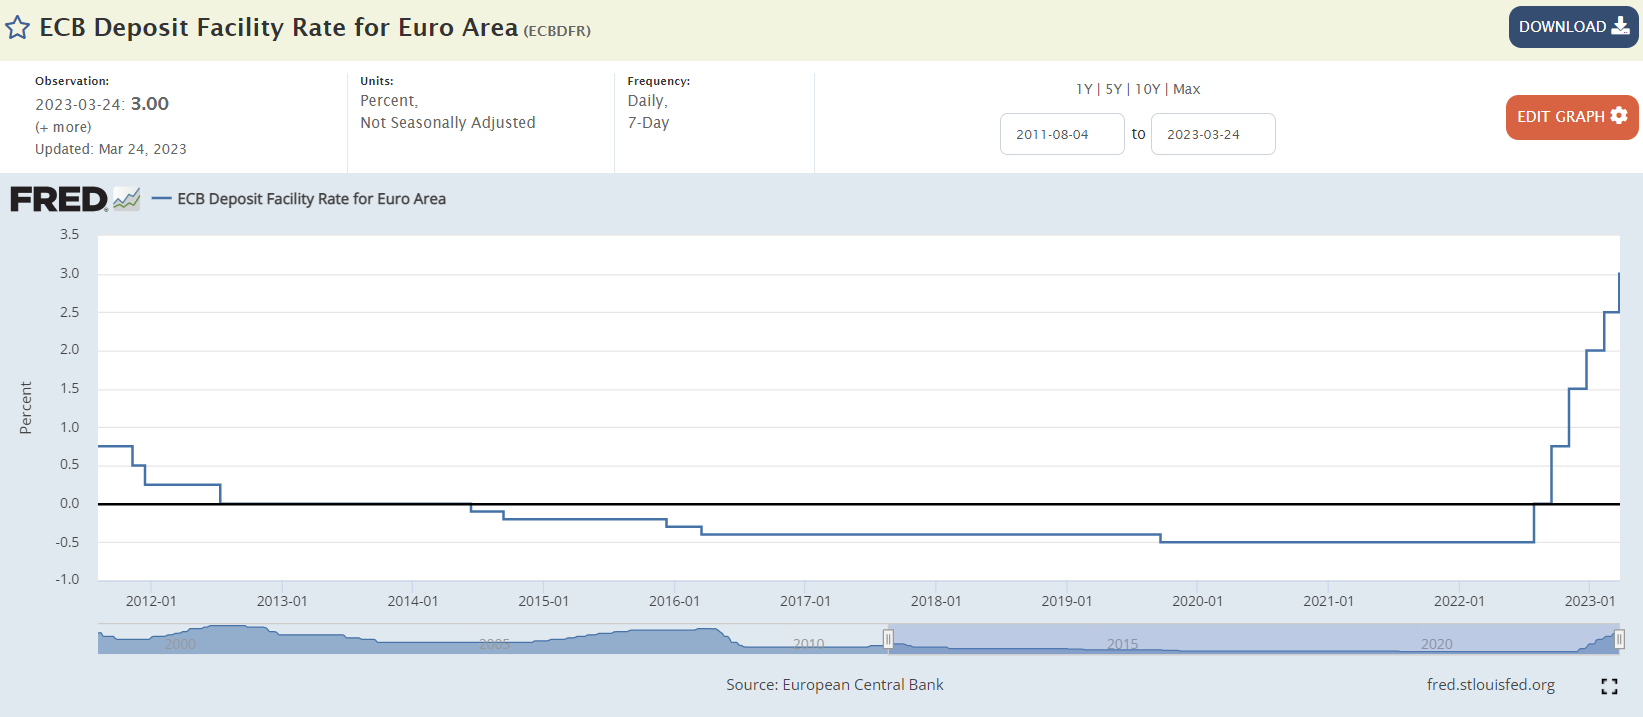

 (Source - dated Sept. 2021)
Did you notice in that ECB excerpt from 2021 that even short-term government bond yields went negative? It seems to defy logic, doesn't it? Who would ever buy a bond with a negative yield? Why didn't we cross OBA's Rubicon? And why wasn't it the end of fiat currency?
The answer is simple. It was a bubble. And in a bubble, yields don't matter, only rising asset prices matter.
Think about rental properties. Why would anyone buy a rental property at a price where they could never make a profit, or even break even, renting it? It's the same as a negative-yielding bond. They buy it to flip it, not to hold an income-producing asset.
Think of all these tech companies with billion dollar valuations that do nothing but lose money. It's all a bubble. Everything is a bubble, and the Fed just popped it.
It's been this way since at least 2015, when I wrote:
What the world needs now is a grand liquidation of overinvested, overvalued, unprofitable economic assets. It needs a grand reboot! But that's not going to happen through the nominal deflation the deflationists hope for. That would be like unwinding a Ponzi scheme. Sure, markets will collapse, and that's what I'm waiting for, but the Fed will respond. Do you think the Fed will raise rates next week? I really hope they do, but they probably won't. Eventually, however, they will be printing and buying everything in sight, because, in the real world, in extremis, that is their only mandate.
FOA: Many of you have read countless opinions as to why our credit markets would implode into deflation as a "Mises" style economic theory surfaced to control the controllers. Truly, these people confuse theory with human action as much as they do not understand real physics! Indeed, strings that cannot be pushed are either thrown or cast aside in the real world.
What the world needs now is a good, old-fashioned hyperinflation! That'll fix shit. And you better get ready, because it's coming! 😀
Ever since 2008, the Fed has been stuffing the banking system with reserves, and the money supply with deposits. I'm going to go over the mechanism one more time, because I know there are still some out there claiming that QE never left the banking system due to our two-tiered money, at least not until the Fed started purchasing securities directly from non-banks.
It is true that our money system is based on two tiers of money, one for banks which we'll call reserves for the purpose of this post, and one for you, me, non-banks and everyone else, which we'll call deposits for the purpose of this post. It is also true that when the Fed buys securities directly from non-banks, deposits and reserves rise simultaneously. But the same happens when the Fed buys securities from banks, whether it be Treasuries or MBS or some other kind of debt security. It just doesn't happen simultaneously. Reserves go up at the point that the Fed buys the security from a bank, and deposits go up at the point that the debtor who the security funded either spends or deposits the borrowed funds.
As I have said before, this chart alone proves that deposits increased in line with QE in the early years:

This is noteworthy because it means that there's likely a 1 to 1 correlation as the Fed is now shrinking its balance sheet, and indeed there is. For every reserve dollar that the Fed retires, a deposit dollar disappears as well.
The point of all this is that the Fed's response to the GFC was to flood the system with money, both reserves and deposits, essentially cash which is normally a non-interest-bearing asset. And indeed, it drove interest rates to zero for most of a decade. Also, remember that as interest rates fall, the prices of debt securities rise, so as the Fed put a floor under interest rates (at zero), it was also essentially putting a ceiling on the price of the securities.
This is relevant because it forced all that money to go in search of a yield elsewhere, which inflated the everything bubble. As debt was capped at no yield, the great asset inflation was underway.
Another important concept you need to understand is that all those deposit dollars, those normally-non-interest-bearing assets, don't flow into other assets. You know this, but it needs to be said. They flow through assets, and end up as deposits in the sellers' accounts. There are only a few ways deposits can actually leave the banking system, and that’s when they are borrowed by someone with a reserve account at the Fed, like the US Treasury or the FHLB, when they are withdrawn as physical cash like you would do at an ATM, when loans are repaid and the banks shrink their balance sheets, or when the Fed sells an asset or lets one mature without reinvesting the proceeds. Theoretically, deposits can also disappear if a bank fails and the government decides not to make large depositors whole, but that's probably not going to happen.
Other than that, all that money is basically trapped in the system. It circulates, but someone, somewhere, is always holding it.
Here's how Hussman puts it:
By early-2022, the Fed was forcing the public to choke down a breathtaking 36% of GDP in zero-interest money, passing like stale, re-gifted fruit cakes from one holder to another (how’s that one Dave?), fueling yield-seeking speculation in every security that might offer the hope of something more than “zero.”
[…]
Given that the Fed has created $8 trillion in liabilities, someone has to hold them either: 1) indirectly as bank deposits, where your bank earns 4.65% interest from the Fed on the reserves that back your deposit, and thanks you for being part of its profitable “zero-interest deposit franchise”; 2) indirectly in a money market fund, where the money market fund receives “interest” on ON-RRP transactions with the Fed, or; 3) directly as currency you just pulled out of the ATM.
That’s it. The Fed created a mountain of liabilities, and someone has to hold them. Whenever someone waxes rhapsodic about all the “cash on the sidelines” waiting to “go into” some other market, they’re basically telling you they haven’t learned how equilibrium works. Every security that’s issued, even base money, must be held by someone until it is retired.
And The Economist:
But money does not actually flow into these [money-market] funds, for they are unable to take deposits. Instead, cash leaving a bank for a money-market fund is credited to the fund’s bank account, from which it is used to purchase the commercial paper or short-term debt in which the fund wants to invest. When the fund uses the cash in this way, it then flows into the bank account of whichever institution sells the asset. Inflows to money-market funds should thus shuffle deposits around the banking system, not force them out.
The point is, when you hear that total deposits are shrinking, which they are, it's not as simple as them running to Treasuries, or MMFs, or stocks or bonds or real estate, or any asset for that matter. For the most part, that money is captive in the system, so for deposits to be shrinking, something systemic is happening, and it's probably being driven by the Fed.
Now, let's look back to 2008 – 2022 and the great (asset) inflation. During that time, deposits grew by more than $11T. Total deposits reached $18T in 2022, up from less than $7T in 2008. That's a lot of new money, but it's really not that much when compared to the great asset inflation, which encompasses stocks, bonds, real estate, private equity, VC, art, you-name-it. All that went up by a lot more than $11T total, and that’s because money doesn't go into assets, it circulates. It flows through them.
Think of all those zero-interest reserves and zero-interest deposits as hot potatoes, or re-gifted fruit cakes. They circulated with a certain velocity driven by zero interest rates as depositors became buyers of assets, and sellers of assets became buyers of different assets, and so on and so forth, in both tiers of our money system, the banks and the rest of us. This is what drove the great asset inflation from 2008 until 2022: Lots of new zero-interest hot potato money printed by the Fed.
The “excess deposits” are there because the Fed put them there. According to the most recent FDIC quarterly banking profile, the U.S. banking system had $17.9 trillion of deposits as of the third quarter of 2022, with estimated insured deposits of $9.9 trillion, leaving $8 trillion of deposits that exceed the FDIC insurance limit. It is not a coincidence that the U.S. banking system also has nearly $8 trillion of bank deposits in excess of bank loans. They are there because more than a decade of “quantitative easing” took bonds out of the hands of the public and replaced those bonds with zero-interest bank deposits.
Meanwhile, overvalued long-term securities dominate portfolios because yield-starved investors and banks couldn’t tolerate the perpetual zero-interest rate world created by the Fed, and felt forced to reach for yield. All of those holders – investors, banks, pension funds, everybody – reached for yield, driving the equity market to valuations beyond their 1929 and 2000 extremes; driving interest rates to historic lows; driving the risk-premiums on low-grade debt to levels that still provide little margin of safety; encouraging speculative new issues of stock and covenant-lite debt; encouraging Silicon Valley Bank and others to invest their excess deposits in securities that might offer them something more than zero. (Hussman)
Then, about a year ago, the Fed started paying real interest on reserves, and everything changed.
That new demand for reserves which the Fed created through the floor system was sent into overdrive. But even before that, the Fed raised the overnight reverse repo rate (ON-RRP, or just RRP, same thing). ON-RRP is like IORB, only for non-banks, mostly money market funds (MMFs). MMFs used to invest mostly in commercial paper and Treasuries, but now about 40% is in ON-RRPs.
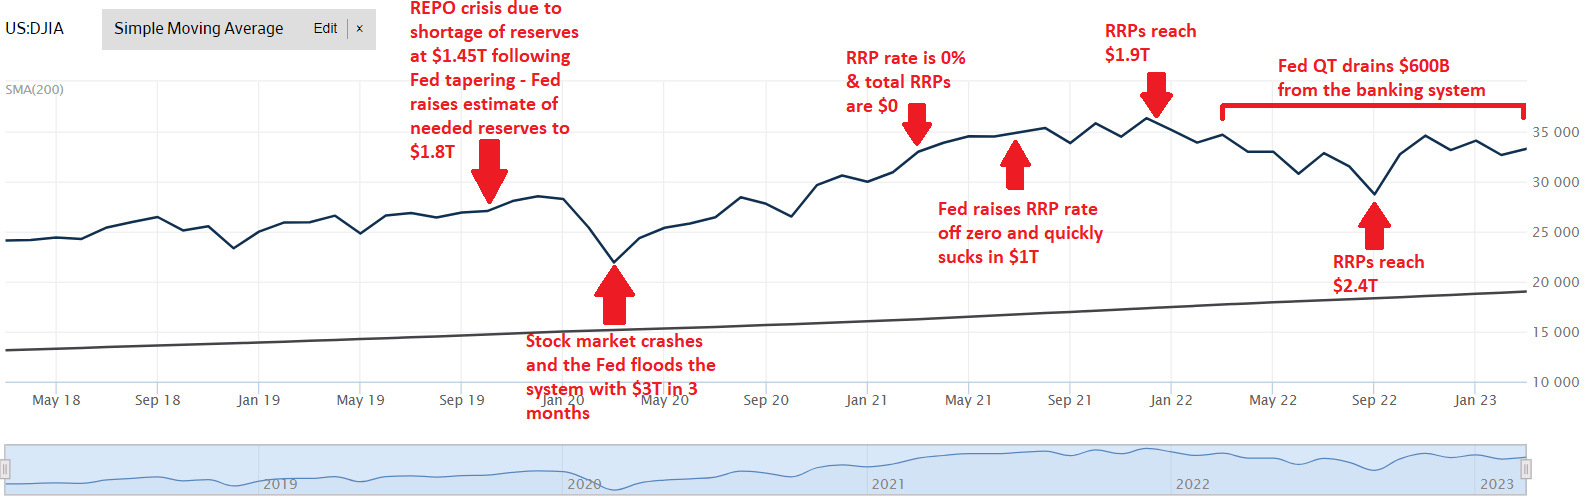
Here's the timeline:
2015-2017: The Fed slowly begins raising rates.
2018: The Fed slowly begins contracting its balance sheet, which removes reserves from the system.
9/17/19: REPO market crisis. REPO rate spikes to 10%, so the Fed pivots and starts cutting rates and adding reserves.
March 2020: Pandemic financial crisis. Stock market crashes. ON-RRP jumps from $1B to $285B in about 2 weeks. The Fed quickly takes FFR and ON-RRP back to zero and floods the system with $3T in newly-printed reserves and deposits over the next 3 months. ON-RRP drops back down to about $1B and the stock market recovers all March losses by August.
June 2021: The Fed raises the ON-RRP rate from zero to 0.05% (5bp), and total RRPs jump from $450B to $1T. The Dow plateaus at 35K (it's currently under 33K).
3/17/22: The Fed starts raising rates and slowly contracting its balance sheet. It raises the FFR from 25bp to 50bp, and the RRP from 5bp to 30bp. RRPs jump from $1.5T to $2.3T in 3 months. The Fed continues hiking rates for the entire year. FFR went from 0.25% (25bp) on 3/16/22 to 5% today (500bp). And the RRP rate went from 0.05% (5bp) on 3/16/22 to 4.8% (480bp) today.
Let's talk about ON-RRPs. Fed liabilities come in three forms: Federal Reserve notes, aka FRNs or physical cash (26%), Reserves (44%), and RRPs (30%). This is all base money. The Fed doesn't count RRPs as base money, but I do, because they make up almost a third of the Fed's current total liabilities. RRPs currently sit at $2.6T on the Fed's balance sheet:


Inflows to money-market funds should thus shuffle deposits around the banking system, not force them out.
And that is what used to happen. Yet there is one new way in which money-market funds may suck deposits from the banking system: the Federal Reserve’s reverse-repo facility, which was introduced in 2013. The scheme was a seemingly innocuous change to the financial system’s plumbing that may, just under a decade later, be having a profoundly destabilising impact on banks.
In a usual repo transaction a bank borrows from competitors or the central bank and deposits collateral in exchange. A reverse repo does the opposite. A shadow bank, such as a money-market fund, instructs its custodian bank to deposit reserves at the Fed in return for securities. The scheme was meant to aid the Fed’s exit from ultra-low rates by putting a floor on the cost of borrowing in the interbank market. After all, why would a bank or shadow bank ever lend to its peers at a lower rate than is available from the Fed?
But use of the facility has jumped in recent years, owing to vast quantitative easing (qe) during covid-19 and regulatory tweaks which left banks laden with cash. qe creates deposits: when the Fed buys a bond from an investment fund, a bank must intermediate the transaction. The fund’s bank account swells; so does the bank’s reserve account at the Fed. From the start of qe in 2020 to its end two years later, deposits in commercial banks rose by $4.5trn, roughly equal to the growth in the Fed’s own balance-sheet.
For a while the banks could cope with the inflows because the Fed eased a rule known as the “Supplementary Leverage Ratio” (slr) at the start of covid. This stopped the growth in commercial banks’ balance-sheets from forcing them to raise more capital, allowing them to safely use the inflow of deposits to increase holdings of Treasury bonds and cash. Banks duly did so, buying $1.5trn of Treasury and agency bonds. Then in March 2021 the Fed let the exemption from the slr lapse. Banks found themselves swimming in unwanted cash. They shrank by cutting their borrowing from money-market funds, which instead parked cash at the Fed. By 2022 the funds had $1.7trn deposited overnight in the Fed’s reverse-repo facility, compared with a few billion a year earlier.
After SVB’s fall, America’s smaller banks fear deposit losses. Monetary tightening has made them even more likely. Use of money-market funds rises along with rates, as Gara Afonso and colleagues at the Federal Reserve Bank of New York find, since returns adjust faster than bank deposits. Indeed, the Fed has raised the rate on overnight-reverse-repo transactions from 0.05% in February 2022 to 4.55%, making it far more alluring than the going rate on bank deposits of 0.4%. The amount money-market funds parked at the Fed in the reverse-repo facility—and thus outside the banks—jumped by half a trillion dollars in the same period.
For those lacking a banking licence, leaving money at the repo facility is a better bet than leaving it in a bank. Not only is the yield higher, but there is no reason to worry about the Fed going bust. Money-market funds could in effect become “narrow banks”: institutions that back consumer deposits with central-bank reserves, rather than higher-return but riskier assets. A narrow bank cannot make loans to firms or write mortgages. Nor can it go bust.
As I said earlier, deposits and the Fed's balance sheet are down almost exactly the same amount from a year ago (down $620B on the Fed's BS prior to SVB, and down $602B in deposits). That's more than $600B disappeared from both tiers of our money system, reserves and deposits, in just the past year.
RRPs have a similar effect. As the total amount of RRPs rises, it doesn't show up as disappearing deposits, but it has the same effect, at least temporarily. It also converts liquid bank reserves, one form of Fed liability, into illiquid (to banks) RRPs, another form of Fed liability. So, as RRPs rise, they pull deposits out of the great asset inflation circulation game, and they change bank reserves into RRPs, which can't be used for clearing or redemptions, and which don't earn the bank any interest. So we can add the $2.4T that went into RRPs over the past two years, to the $600B in reserves and deposits that disappeared over the past year, and that's $3T gone from the $11T in deposits and $8T in reserves that the Fed created since 2008, and which has been inflating the everything bubble.
So, the Fed created a new kind of demand for reserves in 2008, and then sent it into overdrive this past year by cranking the IORB up from 0.15% to 4.9%:

Meanwhile, we saw a spike in "advances" (reserves being borrowed) from the FHLB. The FHLB annual report for last year came out a week ago, on 3/24, and Andrewe1 noted this:
"Sorry, one more comment on the FHLB report. The increase in advances of $470 billion from 2021 occurred mostly in the last three quarters of 2022 (I took a quick look at the 2022 quarterly reports), $146B in Q2, $140B in Q3 and $164B in Q4. So the $470B net increase of mostly less than 1-year terms could just be a ramping up to higher level of activity before reaching steady state or not. Will need more information. But it’s interesting that the activity really began after the Fed launched its rate hiking."
In a report dated 2/23/23, Bill Nelson of the Bank Policy Institute writes:
In a 2013 New York Fed blog post “Who is Lending in the Fed Funds Market?”, Afonso and colleagues report that fed funds lending (and therefore borrowing) fell after the GFC to one-fourth of its pre-GFC level. They attribute the decline to the expansion of the Federal Reserve’s balance sheet and to the payment of interest by the Fed on reserve balances. Banks now hold such large amounts of extra reserves that there is no need to redistribute liquidity at the end of the day. Currently, the federal funds market consists almost entirely of loans from FHLBs (which have extra funds to invest and have accounts at the Fed but do not earn interest) to the U.S. branches of foreign banking organizations, who borrow the funds and deposit them at the Fed, earning the spread. FBOs are the main participants in these transactions, because it is slightly cheaper for them to do so than domestic commercial banks, owing to how deposit insurance premiums are calculated.
This may be another drain on deposits, because if banks are borrowing reserves from the FHLB simply to park them at the Fed and earn the IORB spread, rather than lending them to borrowers which creates deposits, then the FHLB may be facilitating a net drain on deposits in the banking system. The FHLB gets those reserves by borrowing from the bond market. This drains deposits from the banking system until the funds are relent to someone else. But if they're simply being hoarded for free money from the Fed, then it's the same effect as net-borrowing by the FHLB, which I mentioned in my last post:
"That’s a $300B to $400B increase in FHLB net-borrowing over the past year, which could possibly account for the $361B YoY decline in deposits."
This may all sound deflationary, and it is. It's how you pop an everything bubble that you spent the last 13 years inflating. You remove a good portion of the money that was circulating through any and all assets to inflate it, and you suck the rest into interest-bearing "facilities".
Investment losses have emerged since early 2022, both because inflation pressures forced the Fed to normalize rates after 13 years of zero-rate financial repression, and because extreme valuations are never sustained indefinitely. Sudden banking strains in the U.S. and Europe, the British pension crisis last year, all of these are just symptoms of an unwinding bubble. The same process is underway in the equity market, and the downside risk remains absurdly high. (Hussman)
In the area where I now live, housing prices are even higher than they were last year, and last year they were higher than the year before, which was when I bought. But nothing is selling, because the monthly cost of a mortgage has gone up 60%, which should equate to about a 38% drop in prices.
Debt markets are quick to respond to a liquidity contraction like this. Real estate, not so quick. Stock market, also not so quick, but it's coming.
I don't want to get into any specific predictions, because this encompasses everything. But just to give you an idea, I think that a lot of projects that were started a year ago or more are no longer viable, for a whole list of reasons, so I think we could see a great abandoning of projects, accompanied by some unexpected and surprising unemployment it will create. I think that credit which was plentiful is about to become scarce, which will cramp a lot of lifestyles. And as these things start to cascade, watch what happens to the big funds. You know, the ones that manage all the pension funds. If you thought the banking system's balance sheet was impaired, wait until the non-banks are forced to acknowledge what has already happened.
Oh, and guess who was just given the Paul A. Volcker award yesterday, by the National Association for Business Economics… yup, good ol' Janet "There will never be another financial crisis in our lifetime" Yellen:
Happening now: Secretary Janet Yellen accepts the NABE Paul A. Volcker Award #NABE2023 pic.twitter.com/tzmBmZOx4F
— NABE (@nabe_econ) March 30, 2023
You can't make this stuff up.
Things are getting spicy, so you need to stay frosty, and keep an eye out for this guy:

Happy April Fools Eve, and watch out for fools this weekend! 🤡
Sincerely,
FOFOA
1/27/23
The following is a series of comments from the Speakeasy back in January. The POG had just spiked up hard, and MDV asked:
FOFOA What do you suppose is going through the minds of the bullion bankers and those who control the ETFs?
I responded:
Due to what? The POG? or am I missing something that happened?
And he said:
Yes…I’d think if they were quitin the biz that 1650 was a better place.
Here was my reply:
Hello MdV,
OK, yeah, the POG hit a high of $1,923 today. That may seem unexpectedly high to someone who understands my reasoning that the price will collapse in the end, and that the end is near. If the end is so near, why isn't it collapsing? Why is it going up? Why is it so high?
First, here are some first principles to keep in mind when thinking about this:
1. The LBMA bullion banks dominate the paper gold (spot unallocated) market.
More than a quarter of a trillion dollars-worth of spot unallocated transactions occur daily with LBMA members on one or both sides of the transaction. There's no double counting in that number, and it's probably way low, but it dwarfs any other segment of the "gold" market, and therefore drives the POG.
2. The largest LBMA bullion banks can control the POG by expanding or contracting their bullion-denominated books.
This is not unlike how FTX and Alameda Research pumped the price of FTT to make themselves look like billionaires, or with BTC and Tether, how a few whales can control the price of BTC, holding it above $16K, but not letting it rise so fast that the bag hodlers decide to cash out. It's all about controlling the supply. And in the case of the POG, we're talking about the supply of LBMA bullion bank bullion-denominated liabilities.
Now, with these principles in mind, let's think about Bitcoin first. It dropped to around $16K and then just stuck there, as if someone was propping it up. If bag hodlers were still selling at $16K, then the whales had to buy BTC to prop it up. That costs real dollars. So the whales were expanding their BTC hodlings in the face of low demand to control the price, to keep it from falling below $16K.
Over time, demand would come back as people got used to the $16K price, and it would fluctuate between the whales buying or selling BTC to hold it steady. Right now, it's up to $20K. If my hypothesis is correct, then something spiked demand, and it's not necessarily millions of little people rushing into BTC. But whatever it is, the whales who've been controlling the price are probably not the ones pumping it up. Rather, I would think they are selling some of their supply into the spiking demand, to keep it from rising too fast, and perhaps to also bring their BTC hodlings back down to where they were a year ago.
Now think about the bullion banks managing the supply of their own bullion-denominated liabilities. And don't think about physical gold. This is only a matter of supply and demand in paper gold. The supply and demand dynamics in physical gold are disconnected from the POG due to the banking nature of the dominant "gold" market, and in extremis will have the opposite of the expected effect (the price of paper gold will collapse when physical supply can't be found).
When I see the price at $1,923, I'm thinking that the bullion banks are seeing a high demand for their bullion-denominated liabilities right now, and they are probably taking advantage of that to expand the size of their balance sheets, which brings in precious dollars, similar to how the BTC whales reducing their hodlings during high demand brings in dollars. That would, in turn, keep the price from rising so fast as to draw a lot of unwanted attention to gold.
So, what's driving that demand for paper gold? I don't think it's gold bugs, and I don't think it's central banks or sovereigns. I don't know what it is, but there are some things happening right now in the "gold" space.
JPMorgan, who just last month became a GLD custodian with talk about expanding GLD custodianship to Zurich, and possibly even New York, now wants to move into precious metals clearing in Zurich:
https://www.bloomberg.com/news/articles/2023-01-12/gold-giant-jpmorgan-may-move-into-precious-metals-clearing-in-zurich
The Saudis suddenly want "to invest in mining assets globally," and have "inked another partnership agreement with Barrick Gold Limited, a subsidiary of Barrick Gold Corp."
https://www.arabnews.com/node/2230426/business-economy
https://finance.yahoo.com/news/barrick-open-mining-ventures-saudi-155844446.html
On the physical side, London vault holdings are down 116.5 tonnes in December:
https://www.lbma.org.uk/prices-and-data/london-vault-holdings-data
And the GLD inventory has hardly budged. It currently sits at 912 tonnes. It was at 906 tonnes at the beginning of December, and 918 tonnes when I wrote my New Year's post on 12/29. So it's up 6 tonnes from the beginning of December, and down 6 tonnes from about a week ago. And just for the record, JPMorgan's share hasn't changed since my post, so the 6 tonnes came out of HSBC.
As for the 116.5 tonnes that left London in December, I don't think any of that was LBMA reserves. I think it was all allocated, and, for whatever reason, the owners moved it out of London. My reasoning is based in part on the fact that I don't think the LBMA has any reserves other than GLD. Also, the LBMA vault holdings data includes the BOE vault which is all allocated, the data doesn't differentiate between allocated and LBMA reserves (or even mention reserves), and if it had been an allocation and delivery request (which would come out of reserves), I think we would have seen a drop in GLD. Instead, we saw GLD inventory go up in December while someone (could have been CBs, sovereigns or individuals) moved 116 tonnes out of London.
So, we have this apparent movement away from physical centrality (in London), and at the same time we are seeing a spike in demand for LBMA bullion-denominated liabilities (spot unallocated). Simultaneously, we have the Saudis and Barrick talking about a joint mining venture, and JPMorgan expanding its gold-supply-chain-financing business into Switzerland.
Here's another principle to keep in mind:
3. Whenever I hear about ventures or developments in gold mining, paper gold, bullion banking, GLD, or any other pseudo-gold-type stuff, my first thought is that it's more about finance and making dollars than about anything to do with the real stuff.
So, perhaps these various stories have some connection to the spike in demand for paper gold. It trades as a currency, so a spike in demand might come from hedging related to a flurry of pseudo-gold-type stuff happening all at once. I don't think it has anything to do with a spike in demand for physical. Not saying there is or isn't a spiking demand for physical, just that it doesn't affect the price, so it's not driving this POG spike we saw this week.
The apparent diversification out of London is consistent with a "quitin the biz" mindset. The high POG is merely a high currency price (exchange rate) on their own BB liabilities, which can be brought down to near zero on a moment's notice with a simple announcement. They could announce that there are no more reserves, or that they are quitting the biz, halting trading and redemptions, and cashing everyone out. Anything that destroys the perception of a connection between XAU and physical would work.
So I'm gonna just go with Mobgrazer's answer. I doubt they even noticed that the POG is back up to where it was a few years ago. In fact, I didn't notice until you commented on in! 😉
Sincerely,
FOFOA
Then, Jman hit me with this:
Fofoa,
Can you elaborate a little more on the bullion banks ability to cap paper gold price rises? Is their balance sheet expansion capability big enough to offset a significant, fear driven, worldwide move away from the equity and bond markets? I have it in my head that the daily notional values traded in the world bond and equity markets would dwarf the $250 billion a day in paper gold, but am I off base here? I mean, if the BBs have unlimited balance sheet expansion, why would paper gold ever go up at all? Not questioning the end game when paper eventually fails, but just want to better understand the odds of what can happen in the meantime, prior to the demise of paper gold. Thanks man, always appreciate the BB education.
And here was my reply:
Hello Jman,
It's a simple matter of supply and demand. The bullion banks can increase supply, or decrease supply, because the supply we're talking about are their own liabilities.
If your mythical shift from stocks and bonds into gold that overwhelms the trading volume of the LBMA ever happens, then the LBMA will probably be halting trading at that time. Not because it is overwhelmed with demand, but because the $IMFS is collapsing. But, to be clear, I don't see that shift happening during the collapse. Freegold is a revaluation after the collapse, not a run up in the price during the collapse.
It is not my position that the bullion banks are actively capping the price of gold. The price of gold is naturally suppressed because of the nature of its dominant market, which is run by a structured system of banks, and exists as mere notations on their balance sheets.
They are not actively capping it, but they may be passively damping it. Volatility attracts unwanted attention to gold. Plus, passive damping may yield a marginal profit for the banks.
These banks are market makers in almost all of the various "gold" markets, futures, ETFs, and even other exchanges. So they have feelers in more than just the dominant, price-setting market, which is spot unallocated (their own liabilities). This means that they can sense demand differentials between markets.
If I see the POG is rising, I assume that there is strong demand for LBMA "currency gold," because that's the price-setter due to its overwhelming mass (think bowling ball vs. billiard ball). Let's say XAU (currency gold) demand is outstripping demand for futures, ETFs, or even correlated assets. That creates an arbitrage opportunity that the BB can sense before anyone else.
So, rather than match buyers with sellers and just let the price rise and let someone else take the arb, they simply expand their balance sheet, print new XAU, take the dollars, and then go buy the assets to back those new liabilities with the dollars. The demand differential will quickly disappear because the banks are adding supply to the market segment where demand is spiking, and adding to demand to other segments.
Thus, the price rise is relatively suppressed by the banks simply taking the marginal profit from the arb. That doesn't mean the price doesn't rise, just that it doesn't rise as much or as quickly as it would in a real market.
The gold market is different from any other markets because of the LBMA. There are other segments to the market, but they take the price that spot unallocated gives them, and if there's any price differential between market segments, someone arbs it away almost seamlessly.
As a gold bug, you have been trained to think of the gold market in a certain way, similar to other markets. You have been conditioned to think that physical demand feeds back into price through the futures market, and that when the price goes down it's because banks and CBs pounded it down. But there's a better way to understand the gold market that helps make the price movements make more sense.
Let's think about it very generally going back to the 1960s. The gold market in the 60s was basically the dollar, because the dollar was pegged to gold. So there was no gold market per se, other than the CBs managing the peg. That of course failed in 1971, and for the next decade the gold market was more or less a physical market trying to come to terms with the failure of the dollar peg.
The price was set by large London dealers who dealt in large wholesale quantities, and the US even auctioned off some of its gold in an effort to slow the rise which was making the dollar look bad. But volatility attracts the trader mindset, and ultimately, those who were most excited about gold were really just in it to get dollars. And that's when bullion banking came into its own.
The late 70s and early 80s were the beginning of bullion banking, which was a way of making dollars by putting gold back into that fractional reserve cage it escaped in 1971. They could print "currency gold" out of thin air, and they used it to finance Barrick, which turned out to be more of a dollar mining operation than anything else.
Of course, you know the story; one of the bullion banks collapsed in 1984 and had to be bailed out by the Bank of England, who subsequently formed the LBMA in 1987. And as you know, under this new fractional reserve system, the POG declined for the next 20½ years, from 1980 to 2001. Another warned that the physical reserves would run out if the price got below the cost of mining, which it did, and that's when we got Brown's bottom, where the BoE sold half of its gold to the bullion banks.
After that, they let the price rise. But, again, this is a market unlike anything else, because it's a banking system running a currency of its own. LBMA volume was huge from 1997-1999, but not quite as large in the early 2000s. But it was still big enough to dominate, and to therefore be the price-setter.
So, the price rise from 2001-2011 represents a rise in demand for paper gold. GLD is one of the outcomes of that demand. Paper gold was so popular that the bullion banks were able to create a new kind of paper gold that let gold bugs carry the cost of their physical inventory. I don't necessarily think this was how it was discussed in the beginning, but that's essentially what it is, and was, from the beginning.
Note that when the price drops in 2013, GLD is drained. When the price drops, that means a lower demand for paper gold. It doesn't mean anything for physical gold demand, because physical demand doesn't affect the price. In fact, Another told us that Asian buyers like to buy physical when the price goes down. So low demand for paper gold drops the price, and then the relative demand for physical from the East rises, thus we see physical leaving the paper gold vehicle of GLD during low paper gold demand.
This is key to adjusting your thinking: Changes in the POG give us information about the supply and demand dynamics of paper gold only. And since the BBs can control the supply, I'd just say that changes in the POG give us information about the demand for paper gold. Not physical, just paper.
As I showed above with the Asian preference for physical when the price drops, per Another, there may be an inverse correlation between the POG and physical demand. I'm not making that case, just pointing out the possibility. But here's a possible example:
Someone created a chart not too long ago that showed an apparent correlation between the POG and the net gold flow in and out of London, as seen in import/export data. It seemed to show that physical gold flowed into London when the POG was high or rising, and out of London when the POG was low or falling.
His explanation for this correlation was that high physical demand was not only driving up the POG, but drawing physical gold into London. And then when the price was falling, he said there was low demand for physical, so the gold was being sold to someone else, somewhere else. In other words, he says that physical supply and demand dynamics drive the price, and the chart he made proves it.
But the LBMA is not like other markets. The LBMA is a banking system that finances a large part of the global gold supply chain flow, and the LBMA’s physical reserves are the slack in that flow. Think of it as a rope. If it’s tight, i.e., there’s no slack, or any slack is being taken up, that would present as gold flowing OUT of London when physical demand was high (or higher than supply). Likewise, gold would be flowing INTO London when physical demand was low, or supply was higher than demand. London is like the reservoir in a river of physical gold flow.
That’s the opposite of what he was saying.
He was saying: high price = high physical demand = gold flowing into London.
But perhaps it should be: high price = high paper gold demand = low physical gold demand = gold flowing into London.
Take my coat-check analogy and pair it with the slack in the flow rope analogy, and think about GLD as the reservoir, or coat-check. Same idea.
In that case, you’d expect to see GLD inventory rising when gold is flowing into London, and declining when gold is flowing out of London. And that’s exactly what we see!
Again, I'm not trying to make a case for an inverse correlation between physical and paper gold demand. They can both be high, but it's the paper gold demand that drives the price. The apparent inversion may just be from one being marginally higher than the other at a given time.
The bottom line of this whole discussion is that the POG is pretty meaningless, unless you're buying or selling right now. In my opinion, it could potentially double before the LBMA goes kaput, but that's probably unlikely. I don't really give it that much thought. And for people who like to throw around prices like $10K or $20K because they think they're more reasonable than Freegold, they just don't get it.
When the LBMA is gone, it's going to be a whole different gold market. Perceptions of gold will be completely reset. Gold will be used differently. It will regain an ancient value it hasn't had in thousands of years, and things are so different today that you can't really draw a comparison between the two, at least not one that most people will understand.
Nor can you draw a connection between the current POG and one without the LBMA, because they are pricing two different things. You can't come up with a reasonable multiple, because they are two different things. When the LBMA goes away, gold will be set free from fractional reserve banking. It will be set free from use as a currency. It will be restored to pure wealth.
I'll leave it at that for now. 😀
Sincerely,
FOFOA
I wanted to add a note about the LBMA trading volume mentioned in my comments. Back in 2015, the LBMA said it would start releasing volume or turnover data on a regular basis, just like it releases clearing data, which it has been doing since 1997. It essentially said, what we did with the 2011 liquidity survey, we’ll start doing on a regular basis “in the name of transparency.”
Clearing data is released monthly, and the data goes back to 1996, which they first released in 1997. What they publish is the average daily clearing volume for each month, and you can find it here. Daily trading volume is roughly ten times the clearing volume.
The 10:1 multiple comes from the 2011 gold liquidity survey, which revealed a 9.2:1 ratio of turnover to clearing volume. But that included data from only 36 of the 56 full members, or 64% of the LBMA members who might have turnover to report, versus 100% of the clearing members. So, it's probably at least 10:1, and maybe higher. Even the LBMA itself has said that turnover is ten times clearing.
But if you search for LBMA trade volume, you'll find something called LBMA Trade Data, which from what I can tell is garbage data that, beginning in 2020, the LBMA outsourced to NASDAQ, who publishes the data through Bloomberg Terminals and Refinitiv Eikon, both expensive subscriptions. If you have an expensive Bloomberg Terminal (which costs about $25K per year), you have access to the weekly volume, but if you want to see the daily volume, you have to pay an additional subscription fee. Not so transparent, huh?
And not only that, but from what I can tell, the data is complete garbage. For example, the LBMA page quotes average weekly turnover for the 12 weeks from October through December, 2022, at $228.82B, which would be $45.8B per day. The source of this quote is data that is "reported electronically (to NASDAQ) by LBMA members," which "makes it possible for market participants to gauge the size and shape of the London OTC precious metals market, the oldest and biggest financial market for gold in the world."
The problem is that the daily clearing volume for that same period was $31.2B, which would mean that the average daily turnover ($45.8B) was only a multiple of about 1.5x to clearing volume. That makes no sense, and we can have confidence in the clearing data, because it comes directly from the LPMCL, and includes data from 100% of the clearers.
Furthermore, the NASDAQ page boasts $174.33B as the "Record Single Days Volume". But how can the record single-day volume be $174.33B, when the 2011 survey said that the average daily volume for an entire quarter was $240.8B? Note also that clearing volume today is 20% higher than it was during the 2011 survey period.

I should note that the WGC is using this LBMA garbage data too. But even so, it created this nice chart which answer's Jman's question: "I have it in my head that the daily notional values traded in the world bond and equity markets would dwarf the $250 billion a day in paper gold, but am I off base here?" This chart would say yes, if it could talk:

If you are searching for facts you will find them, but the items you find will not be true! Did you think that the high powered world of the LBMA would operate in a fishbowl for all to see? We cannot take what is on the outside as evidence for what is on the inside. To find the answer work with inside assumptions and extrapolate them to the outside!
Yup, that's what I do! 😉
If you would like to subscribe to the Speakeasy, you can do so by clicking on the Subscribe button at the top of the side bar, or you can just click here. No Paypal account is required. Just scroll down and select "Pay with Debit or Credit Card" if you don't have a Paypal account. If you would prefer to subscribe with a single-use invoice rather than signing up for auto-renewal through Paypal, you can email me at fofoamail [at] gmail [dot] com to request an invoice. Either way, the subscription fee is $150 for 6 months. I hope to see you there!
Sincerely,
FOFOA